Grafana && Victoria
Описание
Данный модуль осуществляет сбор логов платформы Bootsman.
Обзор логов
Для обзора логов потребуется установить модуль grafana-operator из раздела мониторинга
Подключение модуля Victoria Logs
Описание Yaml
Внимание!
Values без описания (1) являются продвинутыми настройками и редактировать их не рекомендовано
- Описание
apiVersion: addon.bootsman.tech/v1alpha1
kind: Config
metadata:
  name: CLUSTER_NAME-victoria-logs
  namespace: CLUSTER_NAMESPACE
spec:
  enabled: true (1)
  values:
    global:
      image:
        registry: harbor.bootsman.host/bootsman-nimbus/common-artifacts
    server:
      image:
        repository: victoria-logs
      mode: deployment
      persistentVolume:
        size: 10Gi (2)
      retentionDiskSpaceUsage: 9GiB
      retentionPeriod: 2w
    vector:
      enabled: true
      image:
        repository: harbor.bootsman.host/bootsman-nimbus/common-artifacts/timberio-vector
      tolerations:
        - effect: NoExecute
          operator: Exists
        - effect: NoSchedule
          operator: Exists
- True - включено.
False - выключено
- Размер Дискового пространства, который будет запрошен
- Сколько логов в GiB сохранять в системе
- Сколько дней логов сохранять в системе
Настройка в UI
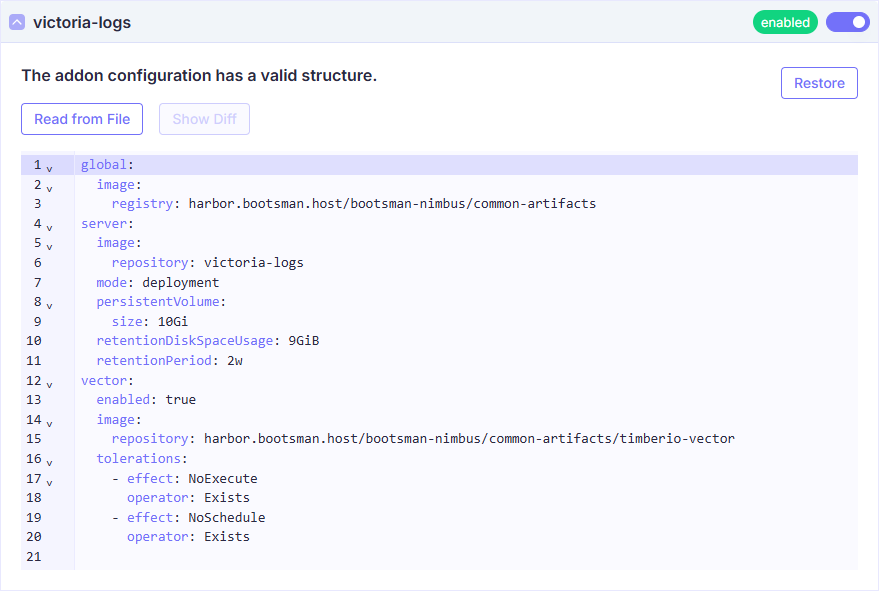

Все Values
Продвинутые настройки
Ниже представлены тонкие настройки модуля.
Используйте их для расширения конфигурации модуля, если потребуется.
Документация
Более полная документация по модулю:
Victoria Logs Docs
Victoria Logs Values
  values:
    # Default values for victoria-logs.
    # This is a YAML-formatted file.
    # Declare variables to be passed into your templates.
    global:
      # -- Image pull secrets, that can be shared across multiple helm charts
      imagePullSecrets: []
      image:
        # -- Image registry, that can be shared across multiple helm charts
        registry: harbor.bootsman.host/bootsman-nimbus/common-artifacts
      # -- Openshift security context compatibility configuration
      compatibility:
        openshift:
          adaptSecurityContext: "auto"
      cluster:
        # -- K8s cluster domain suffix, uses for building storage pods' FQDN. Details are [here](https://kubernetes.io/docs/tasks/administer-cluster/dns-custom-nameservers/)
        dnsDomain: cluster.local.

    # -- Override chart name
    nameOverride: ""

    # -- Print chart notes
    printNotes: true

    serviceAccount:
      # -- Create service account.
      create: false

      # -- The name of the service account to use.
      # If not set and create is true, a name is generated using the fullname template
      name:

      # -- ServiceAccount labels
      extraLabels: {}

      # -- ServiceAccount annotations
      annotations: {}

      # -- Mount API token to pod directly
      automountToken: true

    # -- See `kubectl explain poddisruptionbudget.spec` for more. Details are [here](https://kubernetes.io/docs/tasks/run-application/configure-pdb/)
    podDisruptionBudget:
      enabled: false
      #  minAvailable: 1
      #  maxUnavailable: 1
      # -- PodDisruptionBudget extra labels
      extraLabels: {}

    server:
      # -- Enable deployment of server component. Deployed as StatefulSet
      enabled: true
      image:
        # -- Image registry
        registry: ""
        # -- Image repository
        repository: victoria-logs
        # -- Image tag
        tag: ""
        # -- Image tag suffix, which is appended to `Chart.AppVersion` if no `server.image.tag` is defined
        variant: victorialogs
        # -- Image pull policy
        pullPolicy: IfNotPresent
      # -- Image pull secrets
      imagePullSecrets: []
      # -- Replica count
      replicaCount: 1
      # -- Name of Priority Class
      priorityClassName: ""
      # -- Overrides the full name of server component
      fullnameOverride: ""
      # -- Data retention period. Possible units character: h(ours), d(ays), w(eeks), y(ears), if no unit character specified - month. The minimum retention period is 24h. See these [docs](https://docs.victoriametrics.com/victorialogs/#retention)
      retentionPeriod: 1
      # -- Data retention max capacity. Default unit is GiB. See these [docs](https://docs.victoriametrics.com/victorialogs/#retention-by-disk-space-usage)
      retentionDiskSpaceUsage: 9GiB
      # -- Extra command line arguments for container of component
      extraArgs:
        envflag.enable: true
        envflag.prefix: VM_
        loggerFormat: json
        httpListenAddr: :9428
        http.shutdownDelay: 15s
      # -- Specify pod lifecycle
      lifecycle: {}

      # -- Additional hostPath mounts
      extraHostPathMounts:
        []
        #- name: certs-dir
        #  mountPath: /etc/kubernetes/certs
        #  subPath: ""
        #  hostPath: /etc/kubernetes/certs
        #  readOnly: true

      # -- Extra Volumes for the pod
      extraVolumes:
        []
        #- name: example
        #  configMap:
        #   name: example

      # -- Extra Volume Mounts for the container
      extraVolumeMounts:
        []
        # - name: example
        #   mountPath: /example

      # -- Extra containers to run in a pod with Victoria Logs container
      extraContainers:
        []
        #- name: config-reloader
        #  image: reloader-image

      # -- Init containers for Victoria Logs Pod
      initContainers:
        []

      # -- Node tolerations for server scheduling to nodes with taints. Details are [here](https://kubernetes.io/docs/concepts/configuration/assign-pod-node/)
      tolerations:
        []
        # - key: "key"
        #   operator: "Equal|Exists"
        #   value: "value"
        #   effect: "NoSchedule|PreferNoSchedule"

      # -- Pod's node selector. Details are [here](https://kubernetes.io/docs/concepts/scheduling-eviction/assign-pod-node/#nodeselector)
      nodeSelector: {}

      # -- Pod topologySpreadConstraints
      topologySpreadConstraints: []

      # -- Pod affinity
      affinity: {}

      # -- Additional environment variables (ex.: secret tokens, flags). Details are [here](https://github.com/VictoriaMetrics/VictoriaMetrics#environment-variables)
      env: []

      # -- Specify alternative source for env variables
      envFrom:
        []
        #- configMapRef:
        #    name: special-config

      # -- Container workdir
      containerWorkingDir: ""

      # -- Use an alternate scheduler, e.g. "stork". Check details [here](https://kubernetes.io/docs/tasks/administer-cluster/configure-multiple-schedulers/)
      schedulerName: ""

      emptyDir: {}
      persistentVolume:
        # -- Create/use Persistent Volume Claim for server component. Use empty dir if set to false
        enabled: true

        # -- Override Persistent Volume Claim name
        name: ""

        # -- Array of access modes. Must match those of existing PV or dynamic provisioner. Details are [here](https://kubernetes.io/docs/concepts/storage/persistent-volumes/)
        accessModes:
          - ReadWriteOnce
        # -- Persistent volume annotations
        annotations: {}

        # -- StorageClass to use for persistent volume. Requires server.persistentVolume.enabled: true. If defined, PVC created automatically
        storageClassName: ""

        # -- Existing Claim name. If defined, PVC must be created manually before volume will be bound
        existingClaim: ""

        # -- Bind Persistent Volume by labels. Must match all labels of targeted PV.
        matchLabels: {}

        # -- Mount path. Server data Persistent Volume mount root path.
        mountPath: /storage
        # -- Mount subpath
        subPath: ""
        # -- Size of the volume. Should be calculated based on the logs you send and retention policy you set.
        size: 10Gi

      # -- StatefulSet/Deployment additional labels
      extraLabels: {}
      # -- Pod's additional labels
      podLabels: {}
      # -- Pod's annotations
      podAnnotations: {}

      # -- Resource object. Details are [here](https://kubernetes.io/docs/concepts/configuration/manage-resources-containers/)
      resources:
        {}
        # limits:
        #   cpu: 500m
        #   memory: 512Mi
        # requests:
        #   cpu: 500m
        #   memory: 512Mi

      probe:
        # -- Indicates whether the Container is ready to service requests. If the readiness probe fails, the endpoints controller removes the Pod's IP address from the endpoints of all Services that match the Pod. The default state of readiness before the initial delay is Failure. If a Container does not provide a readiness probe, the default state is Success.
        readiness:
          httpGet: {}
          initialDelaySeconds: 5
          periodSeconds: 5
          timeoutSeconds: 5
          failureThreshold: 3

        # -- Indicates whether the Container is running. If the liveness probe fails, the kubelet kills the Container, and the Container is subjected to its restart policy. If a Container does not provide a liveness probe, the default state is Success.
        liveness:
          tcpSocket: {}
          initialDelaySeconds: 30
          periodSeconds: 30
          timeoutSeconds: 5
          failureThreshold: 10

        # -- Indicates whether the Container is done with potentially costly initialization. If set it is executed first. If it fails Container is restarted. If it succeeds liveness and readiness probes takes over.
        startup: {}
        # tcpSocket: {}
        # failureThreshold: 30
        # periodSeconds: 15
        # successThreshold: 1
        # timeoutSeconds: 5

      # -- Security context to be added to server pods
      securityContext:
        enabled: true
        allowPrivilegeEscalation: false
        capabilities:
          drop:
            - ALL
        readOnlyRootFilesystem: true

      # -- Pod's security context. Details are [here](https://kubernetes.io/docs/tasks/configure-pod-container/security-context/)
      podSecurityContext:
        enabled: true
        fsGroup: 2000
        runAsNonRoot: true
        runAsUser: 1000

      ingress:
        # -- Enable deployment of ingress for server component
        enabled: false

        # -- Ingress annotations
        annotations:
        #   kubernetes.io/ingress.class: nginx
        #   kubernetes.io/tls-acme: 'true'

        # -- Ingress extra labels
        extraLabels: {}

        # -- Array of host objects
        hosts:
          - name: vlogs.local
            path:
              - /
            port: http

        # -- Array of TLS objects
        tls: []
        #   - secretName: vmselect-ingress-tls
        #     hosts:
        #       - vmselect.local

        # -- Ingress controller class name
        ingressClassName: ""

        # -- Ingress path type
        pathType: Prefix

      service:
        # -- Service annotations
        annotations: {}
        # -- Service labels
        labels: {}
        # -- Service ClusterIP
        clusterIP: None
        # -- Service external IPs. Details are [here]( https://kubernetes.io/docs/concepts/services-networking/service/#external-ips)
        externalIPs: []
        # -- Service load balancer IP
        loadBalancerIP: ""
        # -- Load balancer source range
        loadBalancerSourceRanges: []
        # -- Target port
        targetPort: http
        # -- Service port
        servicePort: 9428
        # -- Node port
        # nodePort: 30000
        # -- Service type
        type: ClusterIP
        # -- Extra service ports
        extraPorts: []
        # -- Service external traffic policy. Check [here](https://kubernetes.io/docs/tasks/access-application-cluster/create-external-load-balancer/#preserving-the-client-source-ip) for details
        externalTrafficPolicy: ""
        # -- Health check node port for a service. Check [here](https://kubernetes.io/docs/tasks/access-application-cluster/create-external-load-balancer/#preserving-the-client-source-ip) for details
        healthCheckNodePort: ""
        # -- Service IP family policy. Check [here](https://kubernetes.io/docs/concepts/services-networking/dual-stack/#services) for details.
        ipFamilyPolicy: ""
        # -- List of service IP families. Check [here](https://kubernetes.io/docs/concepts/services-networking/dual-stack/#services) for details.
        ipFamilies: []

      # -- VictoriaLogs mode: deployment, statefulSet
      mode: deployment

      # -- [K8s Deployment](https://kubernetes.io/docs/concepts/workloads/controllers/deployment/) specific variables
      deployment:
        spec:
          strategy:
            # Must be "Recreate" when we have a persistent volume
            type: Recreate

      # -- [K8s StatefulSet](https://kubernetes.io/docs/concepts/workloads/controllers/statefulset/) specific variables
      statefulSet:
        spec:
          # -- Deploy order policy for StatefulSet pods
          podManagementPolicy: OrderedReady
          # -- StatefulSet update strategy. Check [here](https://kubernetes.io/docs/concepts/workloads/controllers/statefulset/#update-strategies) for details.
          updateStrategy: {}
            # type: RollingUpdate

      # -- Pod's termination grace period in seconds
      terminationGracePeriodSeconds: 60
      serviceMonitor:
        # -- Enable deployment of Service Monitor for server component. This is Prometheus operator object
        enabled: false
        # -- Service Monitor labels
        extraLabels: {}
        # -- Service Monitor annotations
        annotations: {}
        # -- Basic auth params for Service Monitor
        basicAuth: {}
        # -- Commented. Prometheus scrape interval for server component
    #    interval: 15s
        # -- Commented. Prometheus pre-scrape timeout for server component
    #    scrapeTimeout: 5s
        # -- Commented. HTTP scheme to use for scraping.
    #    scheme: https
        # -- Commented. TLS configuration to use when scraping the endpoint
    #    tlsConfig:
    #      insecureSkipVerify: true
        # -- Service Monitor relabelings
        relabelings: []
        # -- Service Monitor metricRelabelings
        metricRelabelings: []
        # -- Service Monitor target port
        targetPort: http
      vmServiceScrape:
        # -- Enable deployment of VMServiceScrape for server component. This is Victoria Metrics operator object
        enabled: false
        # VMServiceScrape labels
        extraLabels: {}
        # VMServiceScrape annotations
        annotations: {}
    # -- Commented. VMServiceScrape scrape interval for server component
    #    interval: 15s
    # -- Commented. VMServiceScrape pre-scrape timeout for server component
    #    scrapeTimeout: 5s
    # -- Commented. HTTP scheme to use for scraping.
    #    scheme: https
    # -- Commented. TLS configuration to use when scraping the endpoint
    #    tlsConfig:
    #      insecureSkipVerify: true
        relabelings: []
        metricRelabelings: []
        # -- target port
        targetPort: http

    # -- Values for [vector helm chart](https://github.com/vectordotdev/helm-charts/tree/develop/charts/vector)
    vector:
      # -- Enable deployment of vector
      enabled: true
      image:
        repository: harbor.bootsman.host/bootsman-nimbus/common-artifacts/timberio-vector
      tolerations:
        - effect: NoExecute
          operator: Exists
        - effect: NoSchedule
          operator: Exists
      role: Agent
      dataDir: /vector-data-dir
      resources: {}
      args:
        - -w
        - --config-dir
        - /etc/vector/
      containerPorts:
        - name: prom-exporter
          containerPort: 9090
          protocol: TCP
      service:
        enabled: false
      existingConfigMaps:
        - vl-config
      # -- Forces custom configuration creation in a given namespace even if vector.enabled is false
      customConfigNamespace: ""
      customConfig:
        data_dir: /vector-data-dir
        api:
          enabled: false
          address: 0.0.0.0:8686
          playground: true
        sources:
          k8s:
            type: kubernetes_logs
          internal_metrics:
            type: internal_metrics
        transforms:
          parser:
            type: remap
            inputs: [k8s]
            source: |
              .log = parse_json(.message) ?? .message
              del(.message)
        sinks:
          exporter:
            type: prometheus_exporter
            address: 0.0.0.0:9090
            inputs: [internal_metrics]
          vlogs:
            type: elasticsearch
            inputs: [parser]
            mode: bulk
            api_version: v8
            compression: gzip
            healthcheck:
              enabled: false
            request:
              headers:
                VL-Time-Field: timestamp
                VL-Stream-Fields: stream,kubernetes.pod_name,kubernetes.container_name,kubernetes.pod_namespace
                VL-Msg-Field: message,msg,_msg,log.msg,log.message,log
                AccountID: "0"
                ProjectID: "0"

    # -- Add extra specs dynamically to this chart
    extraObjects: []

    dashboards:
      # -- Create VictoriaLogs dashboards
      enabled: false
      # -- Dashboard labels
      labels: {}
      #  grafana_dashboard: "1"
      # -- Dashboard annotations
      annotations: {}
      # -- Override default namespace, where to create dashboards
      namespace: ""
      grafanaOperator:
        enabled: false
        spec:
          instanceSelector:
            matchLabels:
              dashboards: "grafana"
          allowCrossNamespaceImport: false