Grafana && Victoria
Описание
Данные модули представляют собой комплекс для сбора и визуализации метрик, логов платформы:
- Grafana Operator
- Victoria Metrics
Установка
Рекомендуется установка всех модулей из раздела, но не исключено использование частичного функционала
Требование
Для работы модулей мониторинга и логирования потребуется один из модулей хранилища данных
Подключение модуля Grafana Operator
Описание Yaml
Внимание!
- Описание
apiVersion: addon.bootsman.tech/v1alpha1
kind: Config
metadata:
  name: CLUSTER_NAME-grafana-operator
  namespace: CLUSTER_NAMESPACE
spec:
  enabled: true (1)
  values:
    grafana-suite:
      auth:
        generic_oauth:
          client_secret: GENERIC_OAUTH_CLIENT_SECRET (2)
      dashboards:
        enabled: true
      enabled: true
      global:
        cattle:
          clusterId: CLUSTER_NAME (3)
      image:
        repository: harbor.bootsman.host/bootsman-nimbus/common-artifacts/mirrored-grafana-grafana
        tag: v12.0.2-bootsman-v12.0.2
      persistence:
        accessModes:
        - ReadWriteOnce
        enabled: true
        selector: {}
        size: 1Gi (5)
        storageClass: "" (6)
      server:
        rancherWebHostName: https://example.com (4)
      victoriaLogsDatasource:
        enabled: true
        url: http://victoria-logs-victoria-logs-single-server.victoria-logs:9428
      victoriaMetricsDatasource:
        enabled: true
        url: http://vmsingle-victoria-metrics.monitoring.svc:8429
    image:
      repository: harbor.bootsman.host/bootsman-nimbus/common-artifacts/grafana-grafana-operator
      tag: v5.18.0
- True - включено.
False - выключено
- Будет сгенерировано автоматически, менять не требуется
- Будет сгенерировано автоматически, менять не требуется
- Будет сгенерировано автоматически, менять не требуется
- Размер Volume
- Оставьте пустым для использования Default StorageClass
Настройка в UI
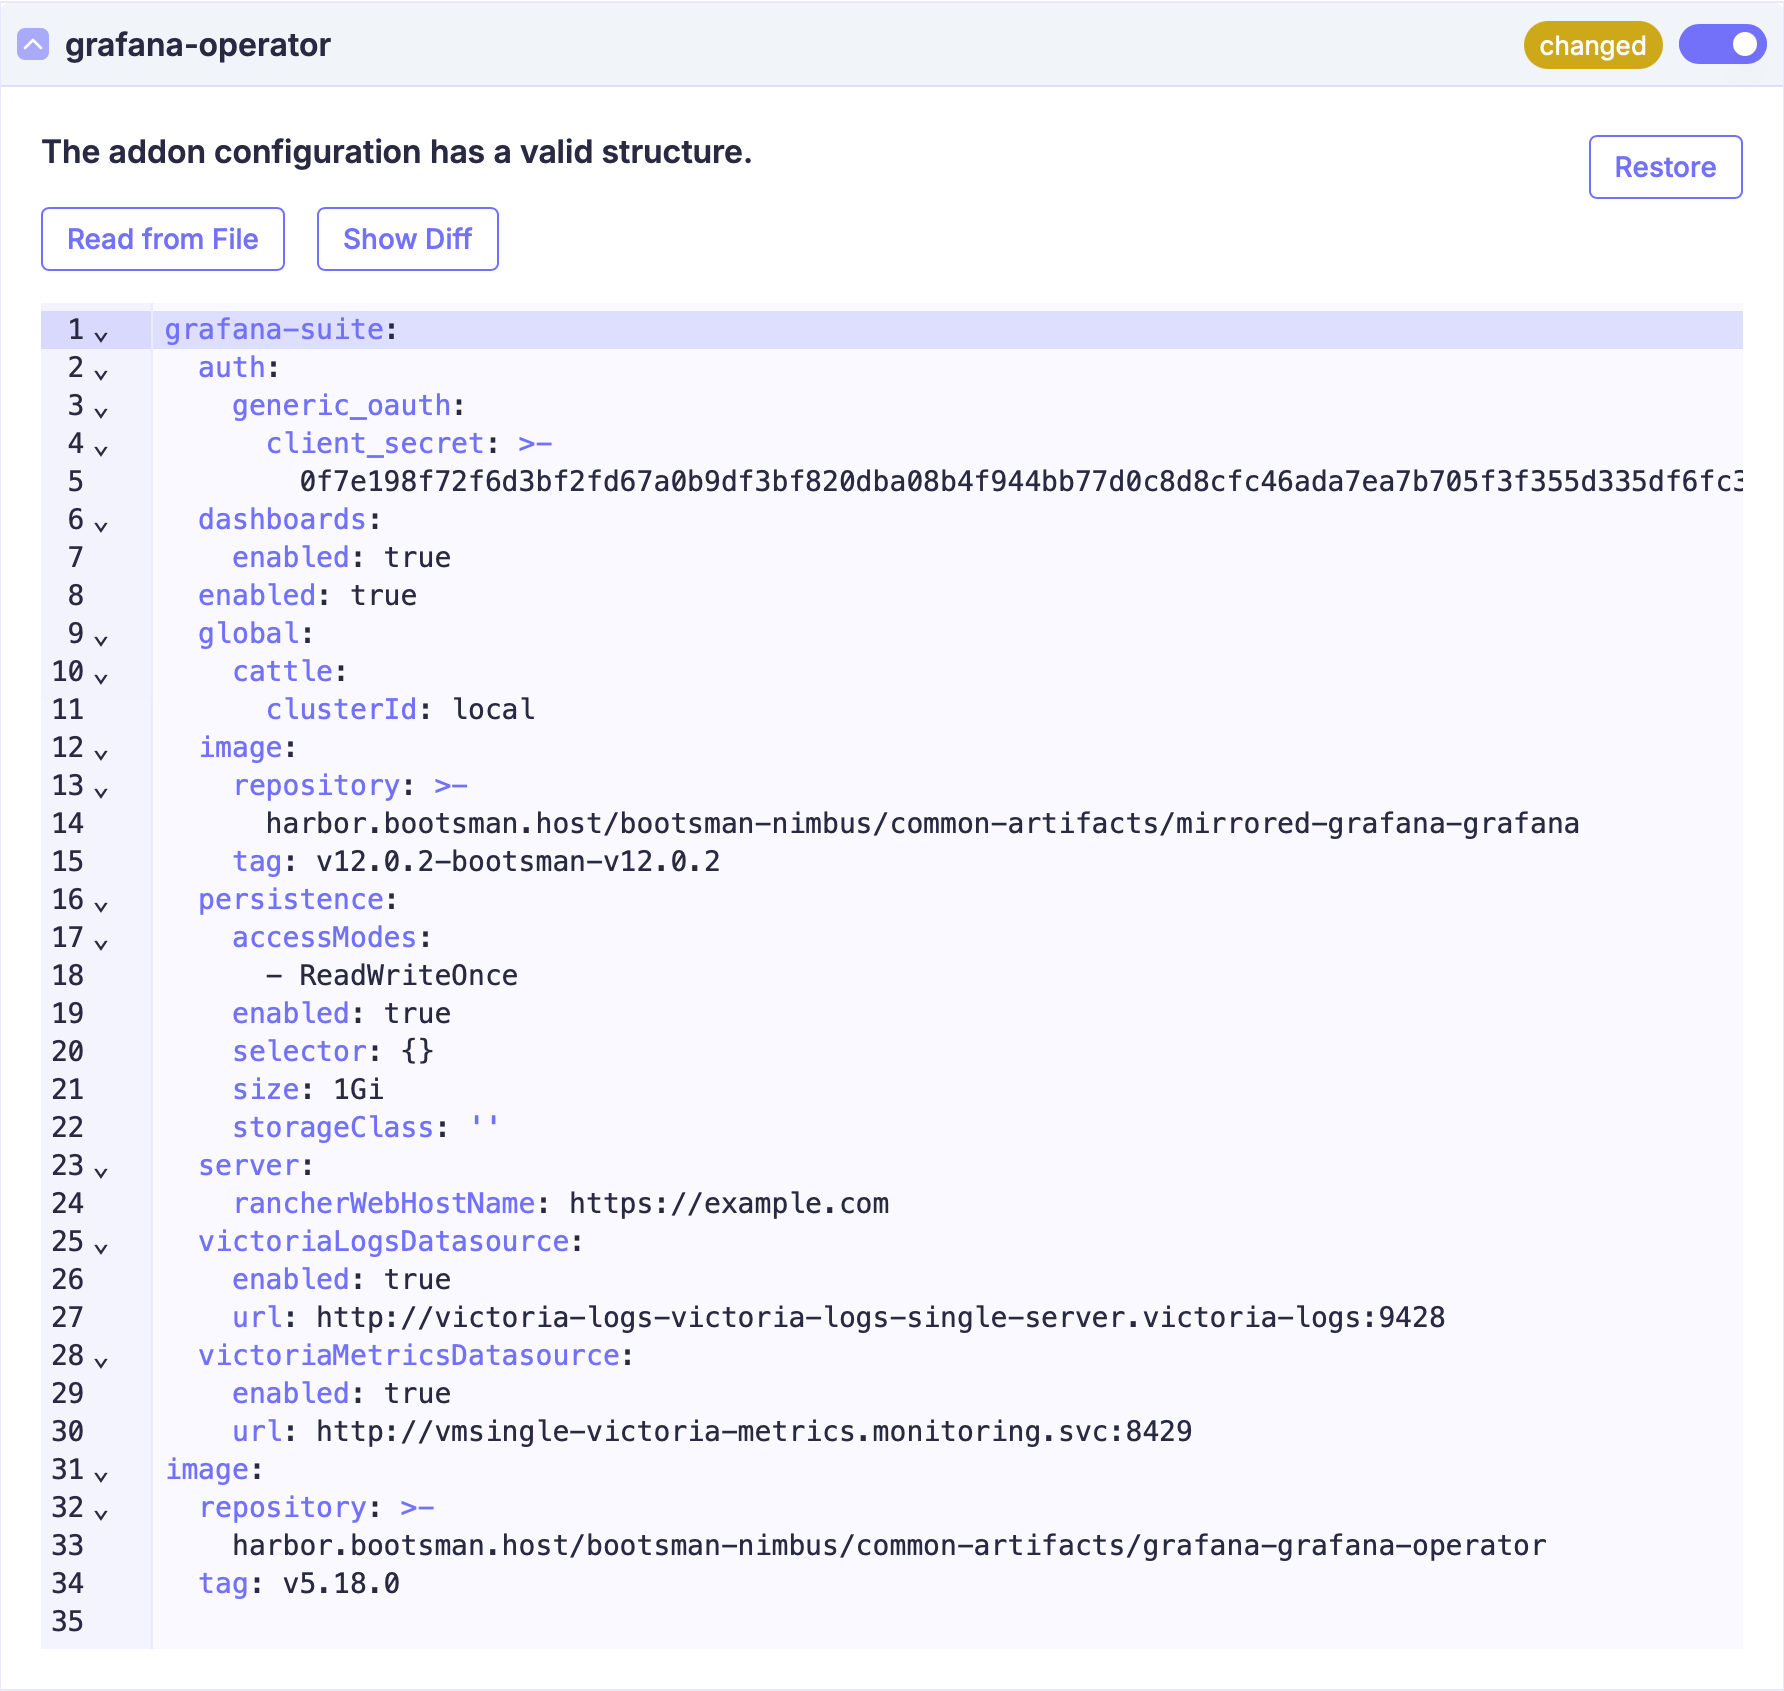
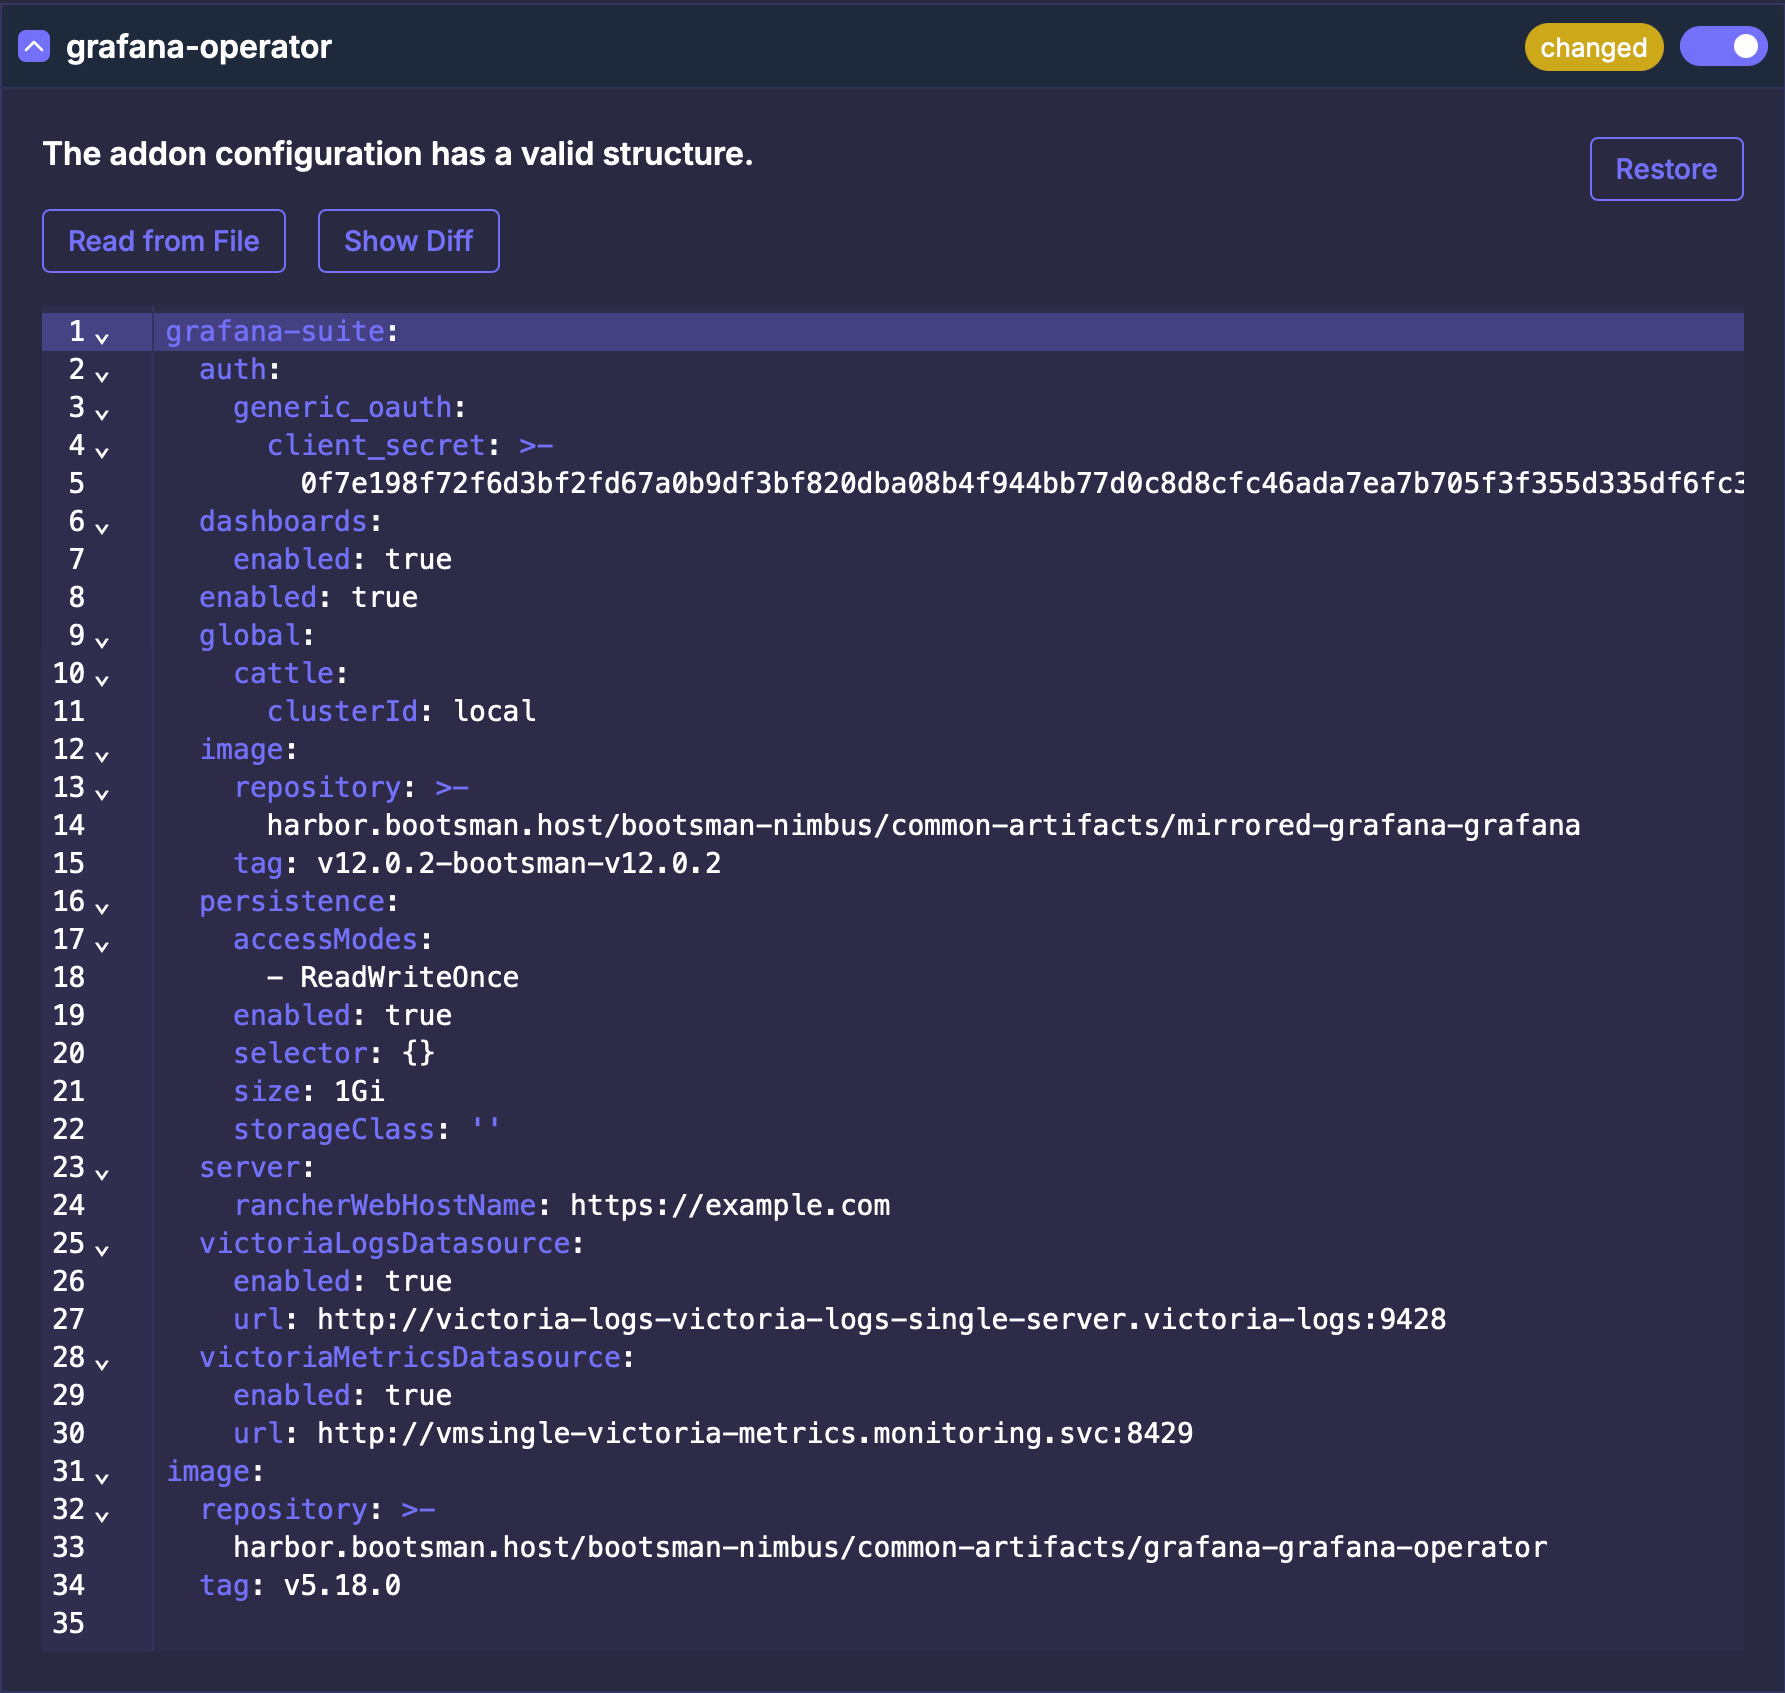
Все Values
Продвинутые настройки
Ниже представлены тонкие настройки модуля.
Используйте их для расширения конфигурации модуля, если потребуется.
Документация
Более полная документация по модулю:
Grafana Operator Docs
Grafana Operator Values
  values:
    # -- If the operator should run in namespace-scope or not,
    # if true the operator will only be able to manage instances in the same namespace
    namespaceScope: false
    # -- This is recommended in most scenarios, even when only running a single instance of the operator.
    leaderElect: true
    # -- The number of operators to run simultaneously.
    # With leader election, only one instance reconciles CRs preventing duplicate reconciliations.
    # Note: Multiple replicas increase stability, it does not increase throughput.
    replicas: 1
    # -- Sets the `WATCH_NAMESPACE` environment variable,
    # it defines which namespaces the operator should be listening for (e.g. `"grafana, foo"`).
    # By default, the operator watches all namespaces. To make it watch only its own namespace, check out `namespaceScope` option instead.
    watchNamespaces: ""
    # -- Sets the `WATCH_NAMESPACE_SELECTOR` environment variable,
    # it defines which namespaces the operator should be listening for based on a namespace label (e.g. `"environment: dev"`).
    # By default, the operator watches all namespaces. To make it watch only its own namespace, check out `namespaceScope` option instead.
    watchNamespaceSelector: ""
    # -- Sets the `WATCH_LABEL_SELECTORS` environment variable,
    # it defines which CRs are watched according to their labels.
    # By default, the operator watches all CRs. To make it watch only a subset of CRs, define the variable as a *stringified label selector*.
    # See also: https://kubernetes.io/docs/concepts/overview/working-with-objects/labels/
    # Beware: Always label Grafana CRs before enabling to ensure labels are inherited.
    # # Existing Secrets/ConfigMaps referenced in CRs also need to be labeled to continue working.
    watchLabelSelectors: ""
    # watchLabelSelectors: "partition in (customerA, customerB),environment!=qa"

    # -- Sets the `ENFORCE_CACHE_LABELS` environment variable,
    # Allows to tweak how caching of various Kubernetes resources works inside the operator.
    # Valid values are "off", "safe", and "all".
    # When set to "off", all resources are cached (including Deployments, Services, Ingresses, and any other native resources that the operator interacts with), which results in much higher memory usage (essentially, grows with cluster size).
    # When set to `safe`, ConfigMaps and Secrets are not cached, all other native resources are cached only when they have `app.kubernetes.io/managed-by: grafana-operator` label. The label is automatically set on all resources that are created/owned by the operator (applicable to any mode).
    # When set to `all`, only resources that have `app.kubernetes.io/managed-by: grafana-operator` are cached. The caveat is that ConfigMaps and Secrets can be seen by the operator only if they have the label. Thus, usage of this mode requires more careful planning.
    enforceCacheLabels: "safe"
    # -- Sets the `CLUSTER_DOMAIN` environment variable,
    # it defines how internal Kubernetes services managed by the operator are addressed.
    # By default, this is empty, and internal services are addressed without a cluster domain specified, i.e., a
    # relative domain name that will resolve regardless of if a custom domain is configured for the cluster. If you
    # wish to have services addressed using their FQDNs, you can specify the cluster domain explicitly, e.g., "cluster.local"
    # for the default Kubernetes configuration.
    clusterDomain: ""
    # -- Maximum number of concurrent reconciles per Custom Resource.
    maxConcurrentReconciles: 1
    # -- Determines if the target cluster is OpenShift. Additional rbac permissions for routes will be added on OpenShift
    isOpenShift: false
    logging:
      # -- Log encoding ("console", "json")
      encoder: console
      # -- Configure the verbosity of logging ("debug", "error", "info")
      level: info
      # -- Time encoding ("epoch", "iso8601", "millis", "nano", "rfc3339", "rfc3339nano")
      time: rfc3339
    # -- Additional environment variables
    env: []
    # -- grafana image, e.g. docker.io/grafana/grafana:9.1.6, overwrites the default grafana image defined in the operator
    # - name: RELATED_IMAGE_GRAFANA
    #   value: "docker.io/grafana/grafana:9.1.6"
    # - name: MY_VAR
    #   value: "myvalue"

    image:
      # -- grafana operator image repository
      repository: harbor.bootsman.host/bootsman-nimbus/common-artifacts/grafana-grafana-operator
      # -- The image pull policy to use in grafana operator container
      pullPolicy: IfNotPresent
      # -- Overrides the image tag whose default is the chart appVersion.
      tag: "v5.18.0"
    # -- image pull secrets
    imagePullSecrets: []
    # -- Overrides the name of the chart.
    nameOverride: ""
    # -- Overrides the fully qualified app name.
    fullnameOverride: ""
    # -- Overrides the namespace name.
    namespaceOverride: ""
    serviceAccount:
      # -- Specifies whether a service account should be created
      create: true
      # -- Annotations to add to the service account
      annotations: {}
      # -- The name of the service account to use.
      # If not set and create is true, a name is generated using the fullname template
      name: ""
    rbac:
      # -- Specifies whether to create the ClusterRole and ClusterRoleBinding.
      # If "namespaceScope" is true or "watchNamespaces" is set, this will create Role and RoleBinding instead.
      create: true
    metricsService:
      # -- metrics service type
      type: ClusterIP
      # -- metrics service port
      metricsPort: 9090
      # -- port for the pprof profiling endpoint
      pprofPort: 8888
    # -- additional labels to add to all resources
    additionalLabels: {}
    # -- pod labels
    podLabels: {}
    # -- pod annotations
    podAnnotations: {}
    # -- pod security context
    podSecurityContext: {}
    securityContext:
      # -- A list of capabilities to drop
      capabilities:
        drop:
          - ALL
      # -- Whether to allow privilege escalation
      allowPrivilegeEscalation: false
      # -- Whether to allow writing to the root filesystem
      readOnlyRootFilesystem: true
      # -- Whether to require a container to run as a non-root user
      runAsNonRoot: true
    # -- grafana operator container resources
    resources: {}
    # -- pod priority class name
    priorityClassName: ""
    # -- pod node selector
    nodeSelector: {}
    # -- pod tolerations
    tolerations: []
    # -- pod affinity
    affinity: {}
    serviceMonitor:
      # -- Whether to create a ServiceMonitor
      enabled: false
      # -- Set of labels to transfer from the Kubernetes Service onto the target
      additionalLabels: {}
      # -- Set how frequently Prometheus should scrape
      interval: 1m
      # -- Set timeout for scrape
      scrapeTimeout: 10s
      # -- Set path to metrics path
      telemetryPath: /metrics
      # -- Set of labels to transfer from the Kubernetes Service onto the target
      targetLabels: []
      # -- MetricRelabelConfigs to apply to samples before ingestion
      metricRelabelings: []
      # -- Set relabel_configs as per https://prometheus.io/docs/prometheus/latest/configuration/configuration/#relabel_config
      relabelings: []
    dashboard:
      # -- Whether to create a ConfigMap containing a dashboard monitoring the operator metrics.
      # Consider enabling this if you are enabling the ServiceMonitor.
      # Optionally, a GrafanaDashboard CR can be manually created pointing to the Grafana.com dashboard ID 22785
      # https://grafana.com/grafana/dashboards/22785-grafana-operator/
      # The Grafana.com dashboard is maintained by the community and does not necessarily match the JSON definition in this repository.
      enabled: false
      # -- Annotations to add to the Grafana dashboard ConfigMap
      annotations: {}
      # -- Labels to add to the Grafana dashboard ConfigMap
      labels: {}
    # -- Array of extra K8s objects to deploy
    extraObjects: []
    # - apiVersion: external-secrets.io/v1beta1
    #   kind: ExternalSecret
    #   metadata:
    #     name: grafana-operator-apikey
    #   spec:
    #     refreshInterval: 1h
    #     secretStoreRef:
    #       kind: SecretStore
    #       name: my-secret-store
    #     target:
    #       template:
    #         data:
    #           GRAFANA_CLOUD_INSTANCE_TOKEN: "{{`{{ .Token }}`}}"
    #     dataFrom:
    #     - extract:
    #         key: my-secret-store-secret

    grafana-suite:
      enabled: true

      global:
        cattle:
          clusterId: CLUSTER_NAME

      image:
        repository: "harbor.bootsman.host/bootsman-nimbus/common-artifacts/mirrored-grafana-grafana"
        tag: "v12.0.2-bootsman-v12.0.2"

      # Server configuration
      server:
        rancherWebHostName: "https://example.com"

      # Authentication settings
      auth:
        adminUser: "admin"
        adminPassword: "prom-operator"
        generic_oauth:
          client_secret: GENERIC_OAUTH_CLIENT_SECRET

      # Node scheduling
      nodeSelector: {}
      tolerations: []
      affinity: {}

      # VictoriaMetrics Datasource configuration
      victoriaMetricsDatasource:
        enabled: true
        url: "http://vmsingle-victoria-metrics.monitoring.svc:8429"

      # VictoriaMetrics Datasource configuration
      victoriaLogsDatasource:
        enabled: true
        url: "http://victoria-logs-victoria-logs-single-server.victoria-logs:9428"

      # Enable grafana-dashboards
      dashboards:
        enabled: true

      # Persistence configuration
      persistence:
        enabled: true
        storageClass: ""
        accessModes:
          - ReadWriteOnce
        size: "1Gi"
        selector: {}
Подключение модуля Victoria Metrics
Описание Yaml
Внимание!
- Описание
apiVersion: addon.bootsman.tech/v1alpha1
kind: Config
metadata:
  name: CLUSTER_NAME-victoria-metrics
  namespace: CLUSTER_NAMESPACE
spec:
  enabled: true (1)
  values:
    alertmanager:
      enabled: true
      spec:
        configReloaderImageTag: harbor.bootsman.host/bootsman-nimbus/common-artifacts/victoriametrics-configmap-reload:v0.8.0
        image:
          repository: harbor.bootsman.host/bootsman-nimbus/common-artifacts/victoriametrics-alertmanager
          tag: v0.28.1
    defaultRules:
      create: true
    global:
      cattle:
        clusterId: CLUSTER_NAME
    kube-state-metrics:
      enabled: true
      image:
        registry: harbor.bootsman.host/bootsman-nimbus/common-artifacts
        repository: victoriametrics-kube-state-metrics
        tag: 2.15.0
    prometheus-node-exporter:
      enabled: true
      image:
        registry: harbor.bootsman.host/bootsman-nimbus/common-artifacts
        repository: victoriametrics-node-exporter
        tag: v1.9.1
    victoria-metrics-operator:
      crds:
        cleanup:
          enabled: true
          image:
            repository: harbor.bootsman.host/bootsman-nimbus/common-artifacts/kubectl
            tag: v1.20.2
        enabled: true
        plain: true
      enabled: true
      image:
        repository: harbor.bootsman.host/bootsman-nimbus/common-artifacts/victoriametrics-operator
        tag: v0.59.2
    vmagent:
      additionalRemoteWrites: []
      enabled: true
      spec:
        configReloaderImageTag: harbor.bootsman.host/bootsman-nimbus/common-artifacts/mirrored-prometheus-operator-prometheus-config-reloader:v0.65.1
        image:
          repository: harbor.bootsman.host/bootsman-nimbus/common-artifacts/victoriametrics-vmagent
          tag: v1.119.0
    vmalert:
      enabled: true
      spec:
        configReloaderImageTag: harbor.bootsman.host/bootsman-nimbus/common-artifacts/victoriametrics-configmap-reload:v0.8.0
        image:
          repository: harbor.bootsman.host/bootsman-nimbus/common-artifacts/victoriametrics-vmalert
          tag: v1.119.0
    vmpushproxy-controller-manager:
      clients:
        copyCertsImage:
          repository: harbor.bootsman.host/bootsman-nimbus/common-artifacts/mirrored-library-busybox
          tag: 1.31.1
        image:
          repository: harbor.bootsman.host/bootsman-nimbus/common-artifacts/pushprox-client
          tag: v0.1.0-rancher2-client
      enabled: true
      proxy:
        image:
          repository: harbor.bootsman.host/bootsman-nimbus/common-artifacts/pushprox-proxy
          tag: v0.1.0-rancher2-proxy
    vmpushproxy-etcd:
      clients:
        copyCertsImage:
          repository: harbor.bootsman.host/bootsman-nimbus/common-artifacts/mirrored-library-busybox
          tag: 1.31.1
        image:
          repository: harbor.bootsman.host/bootsman-nimbus/common-artifacts/pushprox-client
          tag: v0.1.0-rancher2-client
      enabled: true
      proxy:
        image:
          repository: harbor.bootsman.host/bootsman-nimbus/common-artifacts/pushprox-proxy
          tag: v0.1.0-rancher2-proxy
    vmpushproxy-scheduler:
      clients:
        copyCertsImage:
          repository: harbor.bootsman.host/bootsman-nimbus/common-artifacts/mirrored-library-busybox
          tag: 1.31.1
        image:
          repository: harbor.bootsman.host/bootsman-nimbus/common-artifacts/pushprox-client
          tag: v0.1.0-rancher2-client
      enabled: true
      proxy:
        image:
          repository: harbor.bootsman.host/bootsman-nimbus/common-artifacts/pushprox-proxy
          tag: v0.1.0-rancher2-proxy
    vmsingle:
      enabled: true
      ingress:
        enabled: false
      spec:
        image:
          repository: harbor.bootsman.host/bootsman-nimbus/common-artifacts/victoriametrics-victoria-metrics
          tag: v1.119.0
        removePvcAfterDelete: true
        retentionPeriod: 2d (3)
        serviceSpec:
          spec:
            type: ClusterIP
        storage:
          resources:
            requests:
              storage: 20Gi (4)
- True - включено.
False - выключено
- Будет сгенерировано автоматически, менять не требуется
- Период перезаписи логов
- Размер Volume
Настройка в UI

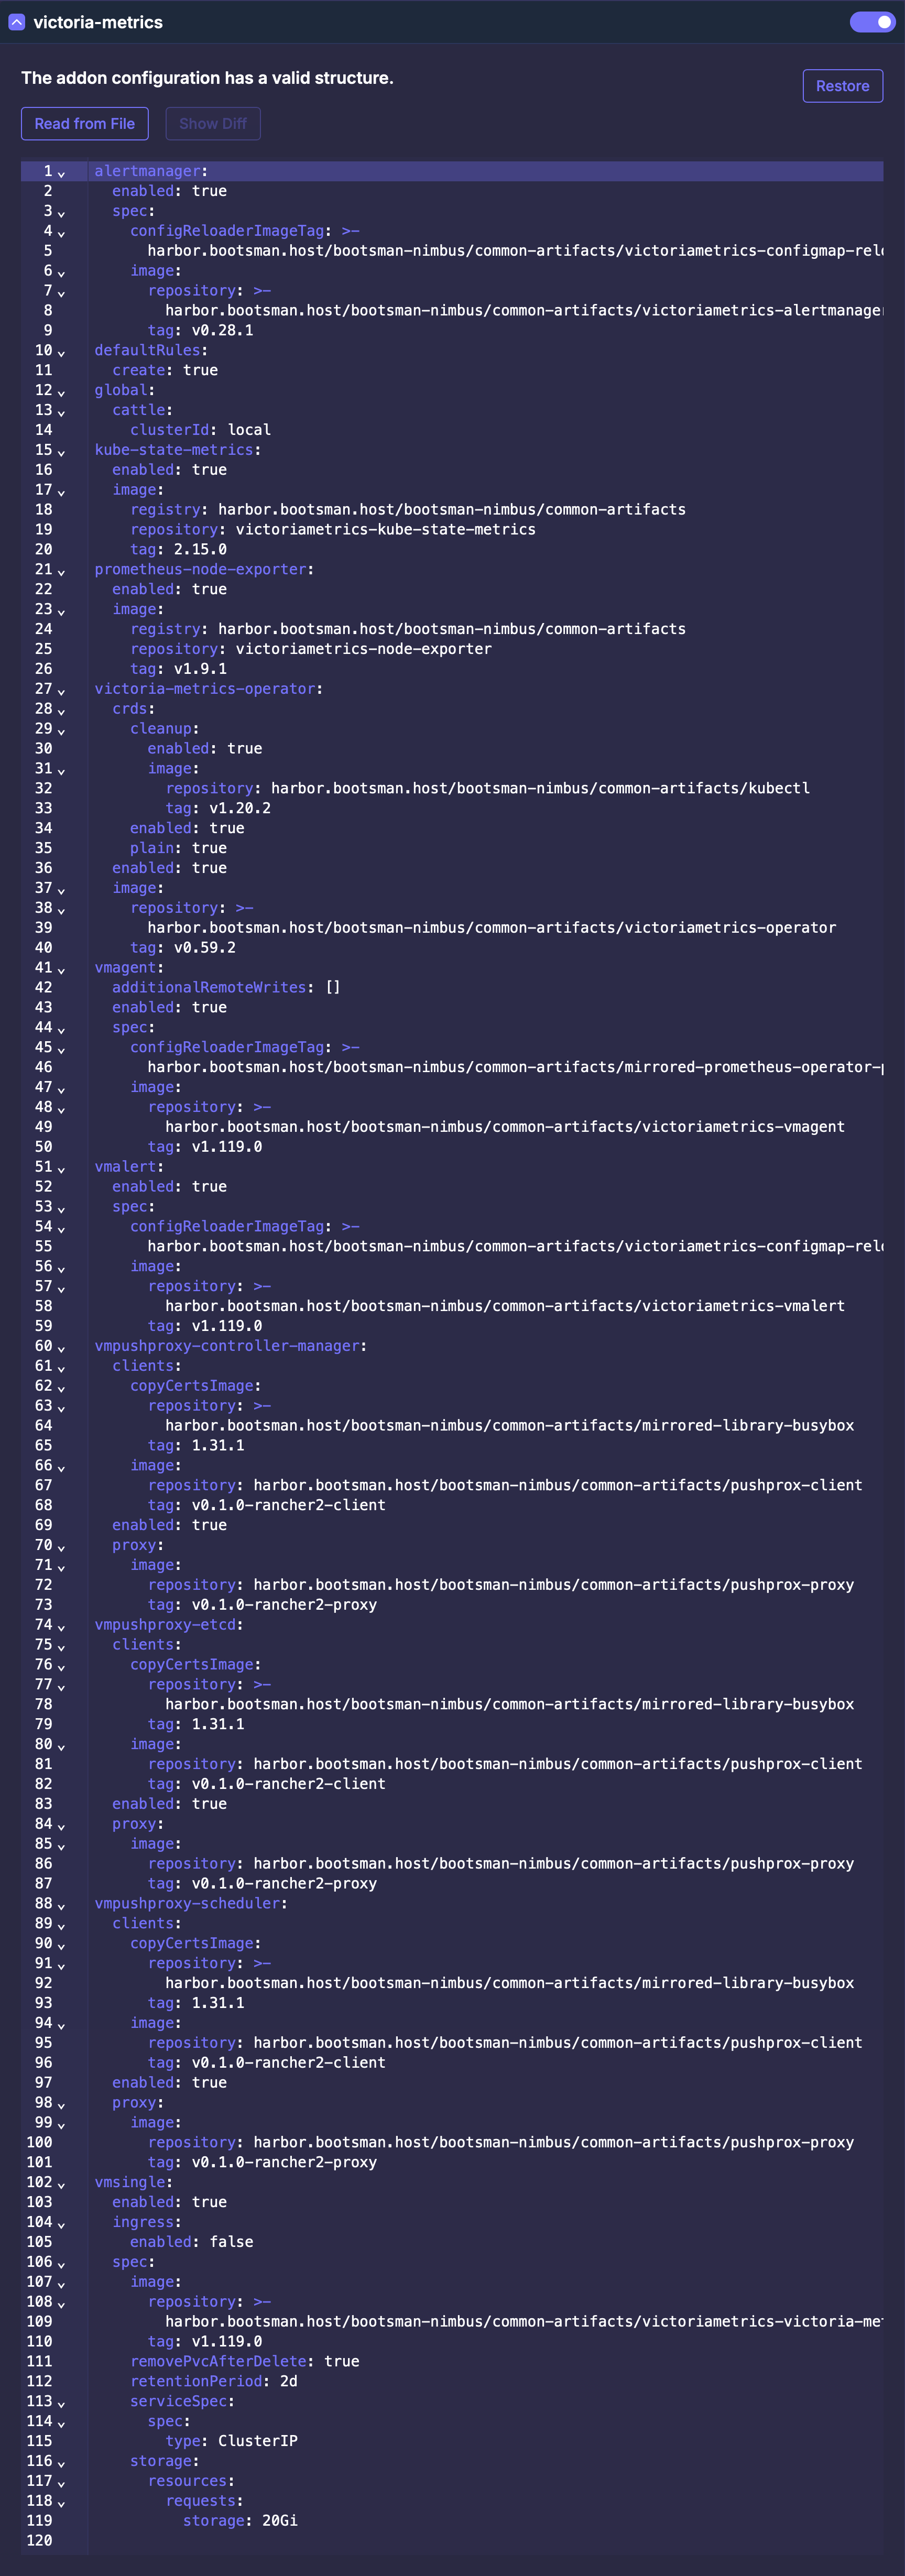
Все Values
Продвинутые настройки
Ниже представлены тонкие настройки модуля.
Используйте их для расширения конфигурации модуля, если потребуется.
Документация
Более полная документация по модулю:
Victoria Metrics Docs
Victoria Metrics Values
values:
global:
# -- Cluster label to use for dashboards and rules
clusterLabel: cluster
# -- Global license configuration
license:
key: ""
keyRef: {}
# name: secret-license
# key: license
cluster:
# -- K8s cluster domain suffix, uses for building storage pods' FQDN. Details are [here](https://kubernetes.io/docs/tasks/administer-cluster/dns-custom-nameservers/)
dnsDomain: cluster.local.
cattle:
clusterId: ""
# -- Override chart name
nameOverride: ""
# -- Resource full name override
fullnameOverride: ""
# -- Tenant to use for Grafana datasources and remote write
tenant: "0"
# -- If this chart is used in "Argocd" with "releaseName" field then
# VMServiceScrapes couldn't select the proper services.
# For correct working need set value 'argocdReleaseOverride=$ARGOCD_APP_NAME'
argocdReleaseOverride: ""
# -- VictoriaMetrics Operator dependency chart configuration. More values can be found [here](https://docs.victoriametrics.com/helm/victoriametrics-operator#parameters). Also checkout [here](https://docs.victoriametrics.com/operator/configuration/#environment-variables) possible ENV variables to configure operator behaviour
victoria-metrics-operator:
enabled: true
crds:
plain: true
cleanup:
enabled: true
image:
repository: bitnami/kubectl
pullPolicy: IfNotPresent
serviceMonitor:
enabled: true
operator:
# -- By default, operator converts prometheus-operator objects.
disable_prometheus_converter: false
defaultDashboards:
# -- Enable custom dashboards installation
enabled: false
defaultTimezone: utc
labels: {}
annotations: {}
grafanaOperator:
# -- Create dashboards as CRDs (requires grafana-operator to be installed)
enabled: false
spec:
instanceSelector:
matchLabels:
dashboards: grafana
allowCrossNamespaceImport: false
# -- Create dashboards as ConfigMap despite dependency it requires is not installed
dashboards:
victoriametrics-vmalert:
enabled: true
victoriametrics-operator:
enabled: true
# -- In ArgoCD using client-side apply this dashboard reaches annotations size limit and causes k8s issues without server side apply
# See [this issue](https://github.com/VictoriaMetrics/helm-charts/tree/master/charts/victoria-metrics-k8s-stack#metadataannotations-too-long-must-have-at-most-262144-bytes-on-dashboards)
node-exporter-full:
enabled: true
# -- Create default rules for monitoring the cluster
defaultRules:
# -- Labels, which are used for grouping results of the queries. Note that these labels are joined with `.Values.global.clusterLabel`
additionalGroupByLabels: []
create: true
# -- Common properties for VMRule groups
group:
spec:
# -- Optional HTTP URL parameters added to each rule request
params: {}
# -- Common properties for all VMRules
rule:
spec:
# -- Additional labels for all VMRules
labels: {}
# -- Additional annotations for all VMRules
annotations: {}
# -- Common properties for VMRules alerts
alerting:
spec:
# -- Additional labels for VMRule alerts
labels: {}
# -- Additional annotations for VMRule alerts
annotations: {}
# -- Common properties for VMRules recording rules
recording:
spec:
# -- Additional labels for VMRule recording rules
labels: {}
# -- Additional annotations for VMRule recording rules
annotations: {}
# -- Per rule properties
rules: {}
# CPUThrottlingHigh:
# create: true
# spec:
# for: 15m
# labels:
# severity: critical
# -- Rule group properties
groups:
etcd:
create: true
# -- Common properties for all rules in a group
rules: {}
# spec:
# annotations:
# dashboard: https://example.com/dashboard/1
general:
create: true
rules: {}
k8sContainerCpuLimits:
create: true
rules: {}
k8sContainerCpuRequests:
create: true
rules: {}
k8sContainerCpuUsageSecondsTotal:
create: true
rules: {}
k8sContainerMemoryLimits:
create: true
rules: {}
k8sContainerMemoryRequests:
create: true
rules: {}
k8sContainerMemoryRss:
create: true
rules: {}
k8sContainerMemoryCache:
create: true
rules: {}
k8sContainerMemoryWorkingSetBytes:
create: true
rules: {}
k8sContainerMemorySwap:
create: true
rules: {}
k8sPodOwner:
create: true
rules: {}
k8sContainerResource:
create: true
rules: {}
kubeApiserver:
create: true
rules: {}
kubeApiserverAvailability:
create: true
rules: {}
kubeApiserverBurnrate:
create: true
rules: {}
kubeApiserverHistogram:
create: true
rules: {}
kubeApiserverSlos:
create: true
rules: {}
kubelet:
create: true
rules: {}
kubePrometheusGeneral:
create: true
rules: {}
kubePrometheusNodeRecording:
create: true
rules: {}
kubernetesApps:
create: true
rules: {}
targetNamespace: ".*"
kubernetesResources:
create: true
rules: {}
kubernetesStorage:
create: true
rules: {}
targetNamespace: ".*"
kubernetesSystem:
create: true
rules: {}
kubernetesSystemKubelet:
create: true
rules: {}
kubernetesSystemApiserver:
create: true
rules: {}
kubernetesSystemControllerManager:
create: true
rules: {}
kubeScheduler:
create: true
rules: {}
kubernetesSystemScheduler:
create: true
rules: {}
kubeStateMetrics:
create: true
rules: {}
nodeNetwork:
create: true
rules: {}
node:
create: true
rules: {}
vmagent:
create: true
rules: {}
vmsingle:
create: true
rules: {}
vmcluster:
create: true
rules: {}
vmHealth:
create: true
rules: {}
vmoperator:
create: true
rules: {}
alertmanager:
create: true
rules: {}
# -- Runbook url prefix for default rules
runbookUrl: https://runbooks.prometheus-operator.dev/runbooks
# -- Labels for default rules
labels: {}
# -- Annotations for default rules
annotations: {}
# -- Provide custom recording or alerting rules to be deployed into the cluster.
additionalVictoriaMetricsMap:
# rule-name:
# groups:
# - name: my_group
# rules:
# - record: my_record
# expr: 100 * my_record
external:
# -- External VM read and write URLs
vm:
read:
url: ""
# bearerTokenSecret:
# name: dbaas-read-access-token
# key: bearerToken
write:
url: ""
# bearerTokenSecret:
# name: dbaas-read-access-token
# key: bearerToken
# Configures vmsingle params
vmsingle:
# -- VMSingle annotations
annotations: {}
# -- Create VMSingle CR
enabled: true
# -- Full spec for VMSingle CRD. Allowed values describe [here](https://docs.victoriametrics.com/operator/api#vmsinglespec)
spec:
port: "8429"
# -- Data retention period. Possible units character: h(ours), d(ays), w(eeks), y(ears), if no unit character specified - month. The minimum retention period is 24h. See these [docs](https://docs.victoriametrics.com/single-server-victoriametrics/#retention)
retentionPeriod: "1"
replicaCount: 1
extraArgs: {}
storage:
accessModes:
- ReadWriteOnce
resources:
requests:
storage: 20Gi
ingress:
# -- Enable deployment of ingress for server component
enabled: false
# -- Ingress annotations
annotations:
{}
# kubernetes.io/ingress.class: nginx
# kubernetes.io/tls-acme: "true"
# -- Ingress extra labels
labels: {}
# -- Ingress default path
path: ""
# -- Ingress path type
pathType: Prefix
# -- Ingress controller class name
ingressClassName: ""
# -- Array of host objects
hosts: []
# - vmsingle.domain.com
# -- Extra paths to prepend to every host configuration. This is useful when working with annotation based services.
extraPaths: []
# - path: /*
# pathType: Prefix
# backend:
# service:
# name: ssl-redirect
# port:
# name: service
# -- Array of TLS objects
tls: []
# - secretName: vmsingle-ingress-tls
# hosts:
# - vmsingle.domain.com
vmcluster:
# -- Create VMCluster CR
enabled: false
# -- VMCluster annotations
annotations: {}
# -- Full spec for VMCluster CRD. Allowed values described [here](https://docs.victoriametrics.com/operator/api#vmclusterspec)
spec:
# -- Data retention period. Possible units character: h(ours), d(ays), w(eeks), y(ears), if no unit character specified - month. The minimum retention period is 24h. See these [docs](https://docs.victoriametrics.com/single-server-victoriametrics/#retention)
retentionPeriod: "1"
replicationFactor: 2
vmstorage:
replicaCount: 2
storageDataPath: /vm-data
storage:
volumeClaimTemplate:
spec:
resources:
requests:
storage: 10Gi
resources:
{}
# limits:
# cpu: "1"
# memory: 1500Mi
vmselect:
# -- Set this value to false to disable VMSelect
enabled: true
port: "8481"
replicaCount: 2
cacheMountPath: /select-cache
extraArgs: {}
storage:
volumeClaimTemplate:
spec:
resources:
requests:
storage: 2Gi
resources:
{}
# limits:
# cpu: "1"
# memory: "1000Mi"
# requests:
# cpu: "0.5"
# memory: "500Mi"
vminsert:
# -- Set this value to false to disable VMInsert
enabled: true
port: "8480"
replicaCount: 2
extraArgs: {}
resources:
{}
# limits:
# cpu: "1"
# memory: 1000Mi
# requests:
# cpu: "0.5"
# memory: "500Mi"
ingress:
storage:
# -- Enable deployment of ingress for server component
enabled: false
# -- Ingress annotations
annotations: {}
# kubernetes.io/ingress.class: nginx
# kubernetes.io/tls-acme: "true"
# -- Ingress extra labels
labels: {}
# -- Ingress controller class name
ingressClassName: ""
# -- Ingress path type
pathType: Prefix
# -- Ingress default path
path: ""
# -- Array of host objects
hosts: []
# - vmstorage.domain.com
# -- Extra paths to prepend to every host configuration. This is useful when working with annotation based services.
extraPaths: []
# - path: /*
# pathType: Prefix
# backend:
# service:
# name: ssl-redirect
# port:
# name: service
# -- Array of TLS objects
tls: []
# - secretName: vmstorage-ingress-tls
# hosts:
# - vmstorage.domain.com
select:
# -- Enable deployment of ingress for server component
enabled: false
# -- Ingress annotations
annotations: {}
# kubernetes.io/ingress.class: nginx
# kubernetes.io/tls-acme: "true"
# -- Ingress extra labels
labels: {}
# -- Ingress controller class name
ingressClassName: ""
# -- Ingress path type
pathType: Prefix
# -- Ingress default path
path: '{{ dig "extraArgs" "http.pathPrefix" "/" .Values.vmcluster.spec.vmselect }}'
# -- Array of host objects
hosts: []
# - vmselect.domain.com
# -- Extra paths to prepend to every host configuration. This is useful when working with annotation based services.
extraPaths: []
# - path: /*
# pathType: Prefix
# backend:
# service:
# name: ssl-redirect
# port:
# name: service
# -- Array of TLS objects
tls: []
# - secretName: vmselect-ingress-tls
# hosts:
# - vmselect.domain.com
insert:
# -- Enable deployment of ingress for server component
enabled: false
# -- Ingress annotations
annotations:
{}
# kubernetes.io/ingress.class: nginx
# kubernetes.io/tls-acme: "true"
# -- Ingress extra labels
labels: {}
# -- Ingress controller class name
ingressClassName: ""
# -- Ingress path type
pathType: Prefix
# -- Ingress default path
path: '{{ dig "extraArgs" "http.pathPrefix" "/" .Values.vmcluster.spec.vminsert }}'
# -- Array of host objects
hosts: []
# - vminsert.domain.com
# -- Extra paths to prepend to every host configuration. This is useful when working with annotation based services.
extraPaths: []
# - path: /*
# pathType: Prefix
# backend:
# service:
# name: ssl-redirect
# port:
# name: service
# -- Array of TLS objects
tls: []
# - secretName: vminsert-ingress-tls
# hosts:
# - vminsert.domain.com
alertmanager:
# -- Create VMAlertmanager CR
enabled: true
# -- Alertmanager annotations
annotations: {}
# -- (object) Full spec for VMAlertmanager CRD. Allowed values described [here](https://docs.victoriametrics.com/operator/api#vmalertmanagerspec)
spec:
replicaCount: 1
port: "9093"
selectAllByDefault: true
image:
tag: v0.28.1
externalURL: ""
routePrefix: /
# -- (string) If this one defined, it will be used for alertmanager configuration and config parameter will be ignored
configSecret: ""
# --
# @raw
# enable storing .Values.alertmanager.config in VMAlertmanagerConfig instead of k8s Secret.
# Note: VMAlertmanagerConfig and plain Alertmanager config structures are not equal.
# If you're migrating existing config, please make sure that `.Values.alertmanager.config`:
# - with `useManagedConfig: false` has structure described [here](https://prometheus.io/docs/alerting/latest/configuration/).
# - with `useManagedConfig: true` has structure described [here](https://docs.victoriametrics.com/operator/api/#vmalertmanagerconfig).
useManagedConfig: false
# -- (object) Alertmanager configuration
config:
route:
receiver: "blackhole"
# group_by: ["alertgroup", "job"]
# group_wait: 30s
# group_interval: 5m
# repeat_interval: 12h
# routes:
#
# # Duplicate code_owner routes to teams
# # These will send alerts to team channels but continue
# # processing through the rest of the tree to handled by on-call
# - matchers:
# - code_owner_channel!=""
# - severity=~"info|warning|critical"
# group_by: ["code_owner_channel", "alertgroup", "job"]
# receiver: slack-code-owners
#
# # Standard on-call routes
# - matchers:
# - severity=~"info|warning|critical"
# receiver: slack-monitoring
# continue: true
#
# inhibit_rules:
# - target_matchers:
# - severity=~"warning|info"
# source_matchers:
# - severity=critical
# equal:
# - cluster
# - namespace
# - alertname
# - target_matchers:
# - severity=info
# source_matchers:
# - severity=warning
# equal:
# - cluster
# - namespace
# - alertname
# - target_matchers:
# - severity=info
# source_matchers:
# - alertname=InfoInhibitor
# equal:
# - cluster
# - namespace
receivers:
- name: blackhole
# - name: "slack-monitoring"
# slack_configs:
# - channel: "#channel"
# send_resolved: true
# title: '{{ template "slack.monzo.title" . }}'
# icon_emoji: '{{ template "slack.monzo.icon_emoji" . }}'
# color: '{{ template "slack.monzo.color" . }}'
# text: '{{ template "slack.monzo.text" . }}'
# actions:
# - type: button
# text: "Runbook :green_book:"
# url: "{{ (index .Alerts 0).Annotations.runbook_url }}"
# - type: button
# text: "Query :mag:"
# url: "{{ (index .Alerts 0).GeneratorURL }}"
# - type: button
# text: "Dashboard :grafana:"
# url: "{{ (index .Alerts 0).Annotations.dashboard }}"
# - type: button
# text: "Silence :no_bell:"
# url: '{{ template "__alert_silence_link" . }}'
# - type: button
# text: '{{ template "slack.monzo.link_button_text" . }}'
# url: "{{ .CommonAnnotations.link_url }}"
# - name: slack-code-owners
# slack_configs:
# - channel: "#{{ .CommonLabels.code_owner_channel }}"
# send_resolved: true
# title: '{{ template "slack.monzo.title" . }}'
# icon_emoji: '{{ template "slack.monzo.icon_emoji" . }}'
# color: '{{ template "slack.monzo.color" . }}'
# text: '{{ template "slack.monzo.text" . }}'
# actions:
# - type: button
# text: "Runbook :green_book:"
# url: "{{ (index .Alerts 0).Annotations.runbook }}"
# - type: button
# text: "Query :mag:"
# url: "{{ (index .Alerts 0).GeneratorURL }}"
# - type: button
# text: "Dashboard :grafana:"
# url: "{{ (index .Alerts 0).Annotations.dashboard }}"
# - type: button
# text: "Silence :no_bell:"
# url: '{{ template "__alert_silence_link" . }}'
# - type: button
# text: '{{ template "slack.monzo.link_button_text" . }}'
# url: "{{ .CommonAnnotations.link_url }}"
#
# -- Better alert templates for [slack source](https://gist.github.com/milesbxf/e2744fc90e9c41b47aa47925f8ff6512)
monzoTemplate:
enabled: true
# -- (object) Extra alert templates
templateFiles:
{}
# template_1.tmpl: |-
# {{ define "hello" -}}
# hello, Victoria!
# {{- end }}
# template_2.tmpl: ""
# -- (object) Alertmanager ingress configuration
ingress:
enabled: false
# For Kubernetes >= 1.18 you should specify the ingress-controller via the field ingressClassName
# See https://kubernetes.io/blog/2020/04/02/improvements-to-the-ingress-api-in-kubernetes-1.18/#specifying-the-class-of-an-ingress
# ingressClassName: nginx
# Values can be templated
annotations:
{}
# kubernetes.io/ingress.class: nginx
# kubernetes.io/tls-acme: "true"
labels: {}
path: '{{ .Values.alertmanager.spec.routePrefix | default "/" }}'
pathType: Prefix
hosts:
- alertmanager.domain.com
# -- Extra paths to prepend to every host configuration. This is useful when working with annotation based services.
extraPaths: []
# - path: /*
# pathType: Prefix
# backend:
# service:
# name: ssl-redirect
# port:
# name: service
tls: []
# - secretName: alertmanager-ingress-tls
# hosts:
# - alertmanager.domain.com
vmalert:
# -- VMAlert annotations
annotations: {}
# -- Create VMAlert CR
enabled: true
# -- Controls whether VMAlert should use VMAgent or VMInsert as a target for remotewrite
remoteWriteVMAgent: false
# -- (object) Full spec for VMAlert CRD. Allowed values described [here](https://docs.victoriametrics.com/operator/api#vmalertspec)
spec:
port: "8080"
selectAllByDefault: true
evaluationInterval: 20s
extraArgs:
http.pathPrefix: "/"
# External labels to add to all generated recording rules and alerts
externalLabels: {}
# -- (object) Extra VMAlert annotation templates
templateFiles:
{}
# template_1.tmpl: |-
# {{ define "hello" -}}
# hello, Victoria!
# {{- end }}
# template_2.tmpl: ""
# -- Allows to configure static notifiers, discover notifiers via Consul and DNS,
# see specification [here](https://docs.victoriametrics.com/vmalert/#notifier-configuration-file).
# This configuration will be created as separate secret and mounted to VMAlert pod.
additionalNotifierConfigs: {}
# dns_sd_configs:
# - names:
# - my.domain.com
# type: 'A'
# port: 9093
# -- (object) VMAlert ingress config
ingress:
enabled: false
# For Kubernetes >= 1.18 you should specify the ingress-controller via the field ingressClassName
# See https://kubernetes.io/blog/2020/04/02/improvements-to-the-ingress-api-in-kubernetes-1.18/#specifying-the-class-of-an-ingress
# ingressClassName: nginx
# Values can be templated
annotations:
{}
# kubernetes.io/ingress.class: nginx
# kubernetes.io/tls-acme: "true"
labels: {}
path: ""
pathType: Prefix
hosts:
- vmalert.domain.com
# -- Extra paths to prepend to every host configuration. This is useful when working with annotation based services.
extraPaths: []
# - path: /*
# pathType: Prefix
# backend:
# service:
# name: ssl-redirect
# port:
# name: service
tls: []
# - secretName: vmalert-ingress-tls
# hosts:
# - vmalert.domain.com
vmauth:
# -- Enable VMAuth CR
enabled: false
# -- VMAuth annotations
annotations: {}
# -- (object) Full spec for VMAuth CRD. Allowed values described [here](https://docs.victoriametrics.com/operator/api#vmauthspec)
# It's possible to use given below predefined variables in spec:
# * `{{ .vm.read }}` - parsed vmselect, vmsingle or external.vm.read URL
# * `{{ .vm.write }}` - parsed vminsert, vmsingle or external.vm.write URL
spec:
port: "8427"
unauthorizedUserAccessSpec:
# -- Flag, that allows to disable default VMAuth unauthorized user access config
disabled: false
discover_backend_ips: true
url_map:
- src_paths:
- '{{ .vm.read.path }}/.*'
url_prefix:
- '{{ urlJoin (omit .vm.read "path") }}/'
- src_paths:
- '{{ .vm.write.path }}/.*'
url_prefix:
- '{{ urlJoin (omit .vm.write "path") }}/'
vmagent:
# -- Create VMAgent CR
enabled: true
# -- VMAgent annotations
annotations: {}
# -- Remote write configuration of VMAgent, allowed parameters defined in a [spec](https://docs.victoriametrics.com/operator/api#vmagentremotewritespec)
additionalRemoteWrites:
[]
#- url: http://some-remote-write/api/v1/write
# -- (object) Full spec for VMAgent CRD. Allowed values described [here](https://docs.victoriametrics.com/operator/api#vmagentspec)
spec:
port: "8429"
selectAllByDefault: true
scrapeInterval: 20s
externalLabels: {}
# For multi-cluster setups it is useful to use "cluster" label to identify the metrics source.
# For example:
# cluster: cluster-name
extraArgs:
promscrape.streamParse: "true"
# Do not store original labels in vmagent's memory by default. This reduces the amount of memory used by vmagent
# but makes vmagent debugging UI less informative. See: https://docs.victoriametrics.com/vmagent/#relabel-debug
promscrape.dropOriginalLabels: "true"
# -- (object) VMAgent ingress configuration
ingress:
enabled: false
# For Kubernetes >= 1.18 you should specify the ingress-controller via the field ingressClassName
# See https://kubernetes.io/blog/2020/04/02/improvements-to-the-ingress-api-in-kubernetes-1.18/#specifying-the-class-of-an-ingress
# ingressClassName: nginx
# Values can be templated
annotations:
{}
# kubernetes.io/ingress.class: nginx
# kubernetes.io/tls-acme: "true"
labels: {}
path: ""
pathType: Prefix
hosts:
- vmagent.domain.com
extraPaths: []
# - path: /*
# pathType: Prefix
# backend:
# service:
# name: ssl-redirect
# port:
# name: service
tls: []
# - secretName: vmagent-ingress-tls
# hosts:
# - vmagent.domain.com
defaultDatasources:
grafanaOperator:
# -- Create datasources as CRDs (requires grafana-operator to be installed)
enabled: false
annotations: {}
spec:
instanceSelector:
matchLabels:
dashboards: grafana
allowCrossNamespaceImport: false
victoriametrics:
# -- Create per replica prometheus compatible datasource
perReplica: false
# -- List of prometheus compatible datasource configurations.
# VM `url` will be added to each of them in templates.
datasources:
- name: VictoriaMetrics
type: prometheus
access: proxy
isDefault: true
- name: VictoriaMetrics (DS)
isDefault: false
access: proxy
type: victoriametrics-metrics-datasource
version: "0.15.1"
# -- List of alertmanager datasources.
# Alertmanager generated `url` will be added to each datasource in template if alertmanager is enabled
alertmanager:
# -- Create per replica alertmanager compatible datasource
perReplica: false
datasources:
- name: Alertmanager
access: proxy
jsonData:
implementation: prometheus
# -- Configure additional grafana datasources (passed through tpl).
# Check [here](http://docs.grafana.org/administration/provisioning/#datasources) for details
extra: []
# - name: prometheus-sample
# access: proxy
# basicAuth: true
# basicAuthPassword: pass
# basicAuthUser: daco
# editable: false
# jsonData:
# tlsSkipVerify: true
# orgId: 1
# type: prometheus
# url: https://{{ printf "%s-prometheus.svc" .Release.Name }}:9090
# version: 1
# -- prometheus-node-exporter dependency chart configuration. For possible values check [here](https://github.com/prometheus-community/helm-charts/blob/main/charts/prometheus-node-exporter/values.yaml)
prometheus-node-exporter:
enabled: true
# all values for prometheus-node-exporter helm chart can be specified here
service:
# Add the 'node-exporter' label to be used by serviceMonitor to match standard common usage in rules and grafana dashboards
#
labels:
jobLabel: node-exporter
extraArgs:
- --collector.filesystem.ignored-mount-points=^/(dev|proc|sys|var/lib/docker/.+|var/lib/kubelet/.+)($|/)
- --collector.filesystem.ignored-fs-types=^(autofs|binfmt_misc|bpf|cgroup2?|configfs|debugfs|devpts|devtmpfs|fusectl|hugetlbfs|iso9660|mqueue|nsfs|overlay|proc|procfs|pstore|rpc_pipefs|securityfs|selinuxfs|squashfs|erofs|sysfs|tracefs)$
# -- Node Exporter VM scrape config
vmScrape:
# whether we should create a service scrape resource for node-exporter
enabled: true
# -- [Scrape configuration](https://docs.victoriametrics.com/operator/api#vmservicescrapespec) for Node Exporter
spec:
jobLabel: jobLabel
selector:
matchLabels:
app.kubernetes.io/name: '{{ include "prometheus-node-exporter.name" (index .Subcharts "prometheus-node-exporter") }}'
endpoints:
- port: metrics
metricRelabelConfigs:
- action: drop
source_labels: [mountpoint]
regex: "/var/lib/kubelet/pods.+"
# -- kube-state-metrics dependency chart configuration. For possible values check [here](https://github.com/prometheus-community/helm-charts/blob/main/charts/kube-state-metrics/values.yaml)
kube-state-metrics:
enabled: true
# -- [Scrape configuration](https://docs.victoriametrics.com/operator/api#vmservicescrapespec) for Kube State Metrics
vmScrape:
enabled: true
spec:
selector:
matchLabels:
app.kubernetes.io/name: '{{ include "kube-state-metrics.name" (index .Subcharts "kube-state-metrics") }}'
app.kubernetes.io/instance: '{{ include "vm.release" . }}'
endpoints:
- port: http
honorLabels: true
metricRelabelConfigs:
- action: labeldrop
regex: (uid|container_id|image_id)
jobLabel: app.kubernetes.io/name
# -- Component scraping the kubelets
kubelet:
enabled: true
vmScrapes:
# -- Enable scraping /metrics/cadvisor from kubelet's service
cadvisor:
enabled: true
spec:
path: /metrics/cadvisor
# -- Enable scraping /metrics/probes from kubelet's service
probes:
enabled: true
spec:
path: /metrics/probes
# -- Enabled scraping /metrics/resource from kubelet's service
resources:
enabled: true
spec:
path: /metrics/resource
kubelet:
spec: {}
# -- Spec for VMNodeScrape CRD is [here](https://docs.victoriametrics.com/operator/api.html#vmnodescrapespec)
vmScrape:
kind: VMNodeScrape
spec:
scheme: "https"
honorLabels: true
interval: "30s"
scrapeTimeout: "5s"
tlsConfig:
insecureSkipVerify: true
caFile: /var/run/secrets/kubernetes.io/serviceaccount/ca.crt
bearerTokenFile: /var/run/secrets/kubernetes.io/serviceaccount/token
# drop high cardinality label and useless metrics for cadvisor and kubelet
metricRelabelConfigs:
- action: labeldrop
regex: (uid)
- action: labeldrop
regex: (id|name)
- action: drop
source_labels: [__name__]
regex: (rest_client_request_duration_seconds_bucket|rest_client_request_duration_seconds_sum|rest_client_request_duration_seconds_count)
relabelConfigs:
- action: labelmap
regex: __meta_kubernetes_node_label_(.+)
- sourceLabels: [__metrics_path__]
targetLabel: metrics_path
- targetLabel: job
replacement: kubelet
# ignore timestamps of cadvisor's metrics by default
# more info here https://github.com/VictoriaMetrics/VictoriaMetrics/issues/4697#issuecomment-1656540535
honorTimestamps: false
# Component scraping the kube api server
kubeApiServer:
# -- Enable Kube Api Server metrics scraping
enabled: true
# -- Spec for VMServiceScrape CRD is [here](https://docs.victoriametrics.com/operator/api.html#vmservicescrapespec)
vmScrape:
spec:
endpoints:
- bearerTokenFile: /var/run/secrets/kubernetes.io/serviceaccount/token
# bearerTokenSecret:
# key: ""
port: https
scheme: https
tlsConfig:
caFile: /var/run/secrets/kubernetes.io/serviceaccount/ca.crt
serverName: kubernetes
jobLabel: component
namespaceSelector:
matchNames:
- default
selector:
matchLabels:
component: apiserver
provider: kubernetes
# Component scraping the kube controller manager
kubeControllerManager:
# -- Enable kube controller manager metrics scraping
enabled: true
# -- If your kube controller manager is not deployed as a pod, specify IPs it can be found on
endpoints: []
# - 10.141.4.22
# - 10.141.4.23
# - 10.141.4.24
# -- Pushprox configuration for secure endpoints scraping
pushprox:
# -- Enable pushprox for kube controller manager (requires vmpushproxy-controller-manager subchart)
enabled: true
# -- Custom proxy URL (if not set, will be generated from subchart service)
proxyUrl: ""
# If using kubeControllerManager.endpoints only the port and targetPort are used
service:
# -- Create service for kube controller manager metrics scraping
enabled: true
# -- Kube controller manager service port
port: 10257
# -- Kube controller manager service target port
targetPort: 10257
# -- Kube controller manager service pod selector
selector:
component: kube-controller-manager
# -- Spec for VMServiceScrape CRD is [here](https://docs.victoriametrics.com/operator/api.html#vmservicescrapespec)
vmScrape:
spec:
jobLabel: component
selector:
matchLabels:
app: vmpushprox-kube-controller-manager-client
component: kube-controller-manager
provider: kubernetes
release: '{{ include "vm.release" . }}'
endpoints:
- port: metrics
params:
_scheme:
- https
relabelConfigs:
- sourceLabels: [__meta_kubernetes_service_label_component]
targetLabel: component
namespaceSelector:
matchNames:
- "{{ include \"vm.namespace\" . }}"
# Component scraping kubeDns. Use either this or coreDns
kubeDns:
# -- Enabled KubeDNS metrics scraping
enabled: false
service:
# -- Create Service for KubeDNS metrics
enabled: false
# -- KubeDNS service ports
ports:
dnsmasq:
port: 10054
targetPort: 10054
skydns:
port: 10055
targetPort: 10055
# -- KubeDNS service pods selector
selector:
k8s-app: kube-dns
# -- Spec for VMServiceScrape CRD is [here](https://docs.victoriametrics.com/operator/api.html#vmservicescrapespec)
vmScrape:
spec:
jobLabel: jobLabel
namespaceSelector:
matchNames: [kube-system]
endpoints:
- port: http-metrics-dnsmasq
bearerTokenFile: /var/run/secrets/kubernetes.io/serviceaccount/token
- port: http-metrics-skydns
bearerTokenFile: /var/run/secrets/kubernetes.io/serviceaccount/token
# Component scraping coreDns. Use either this or kubeDns
coreDns:
# -- Enabled CoreDNS metrics scraping
enabled: true
service:
# -- Create service for CoreDNS metrics
enabled: true
# -- CoreDNS service port
port: 9153
# -- CoreDNS service target port
targetPort: 9153
# -- CoreDNS service pod selector
selector:
k8s-app: kube-dns
# -- Spec for VMServiceScrape CRD is [here](https://docs.victoriametrics.com/operator/api.html#vmservicescrapespec)
vmScrape:
spec:
jobLabel: jobLabel
namespaceSelector:
matchNames: [kube-system]
endpoints:
- port: http-metrics
bearerTokenFile: /var/run/secrets/kubernetes.io/serviceaccount/token
# Component scraping etcd
kubeEtcd:
# -- Enabled KubeETCD metrics scraping
enabled: true
# -- If your etcd is not deployed as a pod, specify IPs it can be found on
endpoints: []
# - 10.141.4.22
# - 10.141.4.23
# - 10.141.4.24
# -- Pushprox configuration for secure endpoints scraping
pushprox:
# -- Enable pushprox for kube controller manager (requires vmpushproxy-etcd subchart)
enabled: true
# -- Custom proxy URL (if not set, will be generated from subchart service)
proxyUrl: ""
# Etcd service. If using kubeEtcd.endpoints only the port and targetPort are used
service:
# -- Enable service for ETCD metrics scraping
enabled: true
# -- ETCD service port
port: 2379
# -- ETCD service target port
targetPort: 2379
# -- ETCD service pods selector
selector:
component: kube-etcd
# -- Spec for VMServiceScrape CRD is [here](https://docs.victoriametrics.com/operator/api.html#vmservicescrapespec)
vmScrape:
spec:
selector:
matchLabels:
app: vmpushprox-kube-etcd-client
component: kube-etcd
provider: kubernetes
release: '{{ include "vm.release" . }}'
endpoints:
- port: metrics
params:
_scheme:
- http
jobLabel: component
namespaceSelector:
matchNames:
- "{{ include \"vm.namespace\" . }}"
# Component scraping kube scheduler
kubeScheduler:
# -- Enable KubeScheduler metrics scraping
enabled: true
# -- If your kube scheduler is not deployed as a pod, specify IPs it can be found on
endpoints: []
# - 10.141.4.22
# - 10.141.4.23
# - 10.141.4.24
# -- Pushprox configuration for secure endpoints scraping
pushprox:
# -- Enable pushprox for kube controller manager (requires vmpushproxy-scheduler subchart)
enabled: true
# -- Custom proxy URL (if not set, will be generated from subchart service)
proxyUrl: ""
# If using kubeScheduler.endpoints only the port and targetPort are used
service:
# -- Enable service for KubeScheduler metrics scrape
enabled: true
# -- KubeScheduler service port
port: 10259
# -- KubeScheduler service target port
targetPort: 10259
# -- KubeScheduler service pod selector
selector:
component: kube-scheduler
# -- Spec for VMServiceScrape CRD is [here](https://docs.victoriametrics.com/operator/api.html#vmservicescrapespec)
vmScrape:
spec:
selector:
matchLabels:
app: vmpushprox-kube-scheduler-client
component: kube-scheduler
endpoints:
- port: metrics
params:
_scheme:
- https
jobLabel: component
namespaceSelector:
matchNames:
- "{{ include \"vm.namespace\" . }}"
# Component scraping kube proxy
kubeProxy:
# -- Enable kube proxy metrics scraping
enabled: false
# -- If your kube proxy is not deployed as a pod, specify IPs it can be found on
endpoints: []
# - 10.141.4.22
# - 10.141.4.23
# - 10.141.4.24
service:
# -- Enable service for kube proxy metrics scraping
enabled: true
# -- Kube proxy service port
port: 10249
# -- Kube proxy service target port
targetPort: 10249
# -- Kube proxy service pod selector
selector:
k8s-app: kube-proxy
# -- Spec for VMServiceScrape CRD is [here](https://docs.victoriametrics.com/operator/api.html#vmservicescrapespec)
vmScrape:
spec:
jobLabel: jobLabel
namespaceSelector:
matchNames: [kube-system]
endpoints:
- bearerTokenFile: /var/run/secrets/kubernetes.io/serviceaccount/token
# bearerTokenSecret:
# key: ""
port: http-metrics
scheme: https
tlsConfig:
caFile: /var/run/secrets/kubernetes.io/serviceaccount/ca.crt
# Component scraping Cilium agent
cilium:
# -- Enable cilium pod metrics scraping
enabled: true
# -- Spec for VMPodScrape CRD is [here](https://docs.victoriametrics.com/operator/api.html#vmpodscrapespec)
vmScrape:
kind: VMPodScrape
spec:
# -- Namespace where Cilium pods are running
namespaceSelector:
matchNames: [kube-system]
# -- Select Cilium pods via label
selector:
matchLabels:
k8s-app: cilium
# -- Define podMetricsEndpoints for scraping
podMetricsEndpoints:
- interval: 30s
port: prometheus
# Component scraping Longhorn manager
longhorn:
# -- Enable Longhorn manager metrics scraping
enabled: true
# -- Disable adding common Helm release labels to selector.matchLabels
disableSelectorLabels: true
service:
# -- Enable service for Longhorn manager metrics scraping
enabled: true
# -- Longhorn manager service port
port: 9500
# -- Longhorn manager service target port
targetPort: 9500
# -- Selector to find Longhorn manager pods
selector:
app: longhorn-manager
# -- Spec for VMServiceScrape CRD is [here](https://docs.victoriametrics.com/operator/api.html#vmservicescrapespec)
vmScrape:
spec:
selector:
matchLabels:
app: longhorn-manager
namespaceSelector:
matchNames:
- longhorn-system
endpoints:
- port: manager
# Component scraping Rancher metrics
rancher:
# -- Enable Rancher metrics scraping
enabled: false
# -- Create RBAC for bearerTokenFile endpoints
createRBAC: false
# -- Disable adding common Helm release labels to selector.matchLabels
disableSelectorLabels: true
# -- Spec for VMServiceScrape CRD is [here](https://docs.victoriametrics.com/operator/api.html#vmservicescrapespec)
vmScrape:
spec:
endpoints:
- bearerTokenFile: /var/run/secrets/kubernetes.io/serviceaccount/token
interval: 30s
path: /metrics
port: https-internal
scheme: https
tlsConfig:
caFile: /var/run/secrets/kubernetes.io/serviceaccount/ca.crt
insecureSkipVerify: true
namespaceSelector:
matchNames:
- cattle-system
selector:
matchLabels:
app: rancher
# Component scraping capi controller manager metrics
capi-controller-manager:
# -- Enable capi controller manager metrics scraping
enabled: true
# -- Create RBAC for bearerTokenFile endpoints
createRBAC: true
# -- Spec for VMPodScrape CRD is [here](https://docs.victoriametrics.com/operator/api.html#vmpodscrapespec)
vmScrape:
kind: VMPodScrape
spec:
# -- Namespace where CAPI pods are running
namespaceSelector:
matchNames: [capi-system]
# -- Select CAPI pods via label
selector:
matchLabels:
cluster.x-k8s.io/provider: cluster-api
control-plane: controller-manager
# -- Define podMetricsEndpoints for scraping
podMetricsEndpoints:
- interval: 30s
path: /metrics
port: metrics
scheme: https
bearerTokenFile: /var/run/secrets/kubernetes.io/serviceaccount/token
tlsConfig:
caFile: /var/run/secrets/kubernetes.io/serviceaccount/ca.crt
insecureSkipVerify: true
# Component scraping caaph controller manager metrics
caaph-controller-manager:
# -- Enable caaph controller manager metrics scraping
enabled: true
# -- Create RBAC for bearerTokenFile endpoints
createRBAC: true
# -- Disable adding common Helm release labels to selector.matchLabels
disableSelectorLabels: true
# -- Spec for VMServiceScrape CRD is [here](https://docs.victoriametrics.com/operator/api.html#vmservicescrapespec)
vmScrape:
spec:
endpoints:
- bearerTokenFile: /var/run/secrets/kubernetes.io/serviceaccount/token
interval: 30s
path: /metrics
port: https
scheme: https
tlsConfig:
caFile: /var/run/secrets/kubernetes.io/serviceaccount/ca.crt
insecureSkipVerify: true
namespaceSelector:
matchNames:
- caaph-system
selector:
matchLabels:
cluster.x-k8s.io/provider: addon-helm
control-plane: controller-manager
# Component scraping Provisioning controller manager
provisioning-controller-manager:
# -- Enable Provisioning controller manager metrics scraping
enabled: true
# -- Create RBAC for bearerTokenFile endpoints
createRBAC: true
# -- Disable adding common Helm release labels to selector.matchLabels
disableSelectorLabels: true
# -- Spec for VMServiceScrape CRD is [here](https://docs.victoriametrics.com/operator/api.html#vmservicescrapespec)
vmScrape:
spec:
endpoints:
- bearerTokenFile: /var/run/secrets/kubernetes.io/serviceaccount/token
interval: 30s
path: /metrics
port: https
scheme: https
tlsConfig:
caFile: /var/run/secrets/kubernetes.io/serviceaccount/ca.crt
insecureSkipVerify: true
namespaceSelector:
matchNames:
- provisioning-system
selector:
matchLabels:
cluster.x-k8s.io/provider: addon-provisioning
# Component scraping ingress-nginx controller metrics
ingressNginx:
# -- Enable ingress-nginx controller metrics scraping
enabled: true
# -- Disable adding common Helm release labels to selector.matchLabels
disableSelectorLabels: true
service:
# -- Enable service for ingress-nginx controller metrics scraping
enabled: true
# -- Namespace where ingress-nginx controller is running
namespace: nginx-ingress
# -- ingress-nginx metrics service port
port: 10254
# -- ingress-nginx metrics service target port
targetPort: 10254
# -- Selector to find ingress-nginx controller pods
selector:
app.kubernetes.io/name: ingress-nginx
app.kubernetes.io/component: controller
# -- Spec for VMServiceScrape CRD is [here](https://docs.victoriametrics.com/operator/api.html#vmservicescrapespec)
vmScrape:
spec:
selector:
matchLabels:
app.kubernetes.io/name: ingress-nginx
app.kubernetes.io/component: controller
namespaceSelector:
matchNames:
- nginx-ingress
endpoints:
- port: metrics
path: /metrics
jobLabel: app.kubernetes.io/component
# -- Add extra objects dynamically to this chart
extraObjects: []